
What WatchZit does
A network map like The Dude, metrics and alerts like Zabbix, dashboards like Grafana — in one console that is easy to install.
Network maps
Devices with their live state and the traffic on every cable, real pictures of some 3,500 device models, racks, HA groups, VLANs and submaps — drawn by hand or by WatchZit itself.
Discovery
Ping sweeps, SNMP, LLDP/CDP and ARP neighbours find the devices of a network and suggest the links between them.
Checks and SNMP
Ping, TCP, HTTP(S) with certificate expiry, web scenarios, DNS, SNMP v1/v2c/v3, MikroTik RouterOS, PostgreSQL, MySQL and JSON APIs.
Agent and remote collectors
A small agent for Windows and Linux reports what the network cannot see; at a branch office it runs the checks of its whole site.
Graphs and dashboards
Years of history, zoom, panels you arrange and colour, and data sources such as PostgreSQL, SQL Server, Prometheus and InfluxDB.
Alerts
Thresholds, forecasts, dependencies and maintenance windows; email, Slack, Teams, Discord, Telegram, ntfy, PagerDuty, SMS or webhooks.
Syslog, traps and flows
Syslog messages, SNMP traps and agent event logs in one searchable place; NetFlow, IPFIX and sFlow show who uses the bandwidth.
Configuration backups
Nightly backups of MikroTik, Cisco IOS and FortiGate configurations over SSH, with every change shown line by line.
See the console
Screenshots of WatchZit 1.3 with a demo network of 4 sites and 69 devices. Click a picture to see it in full size.
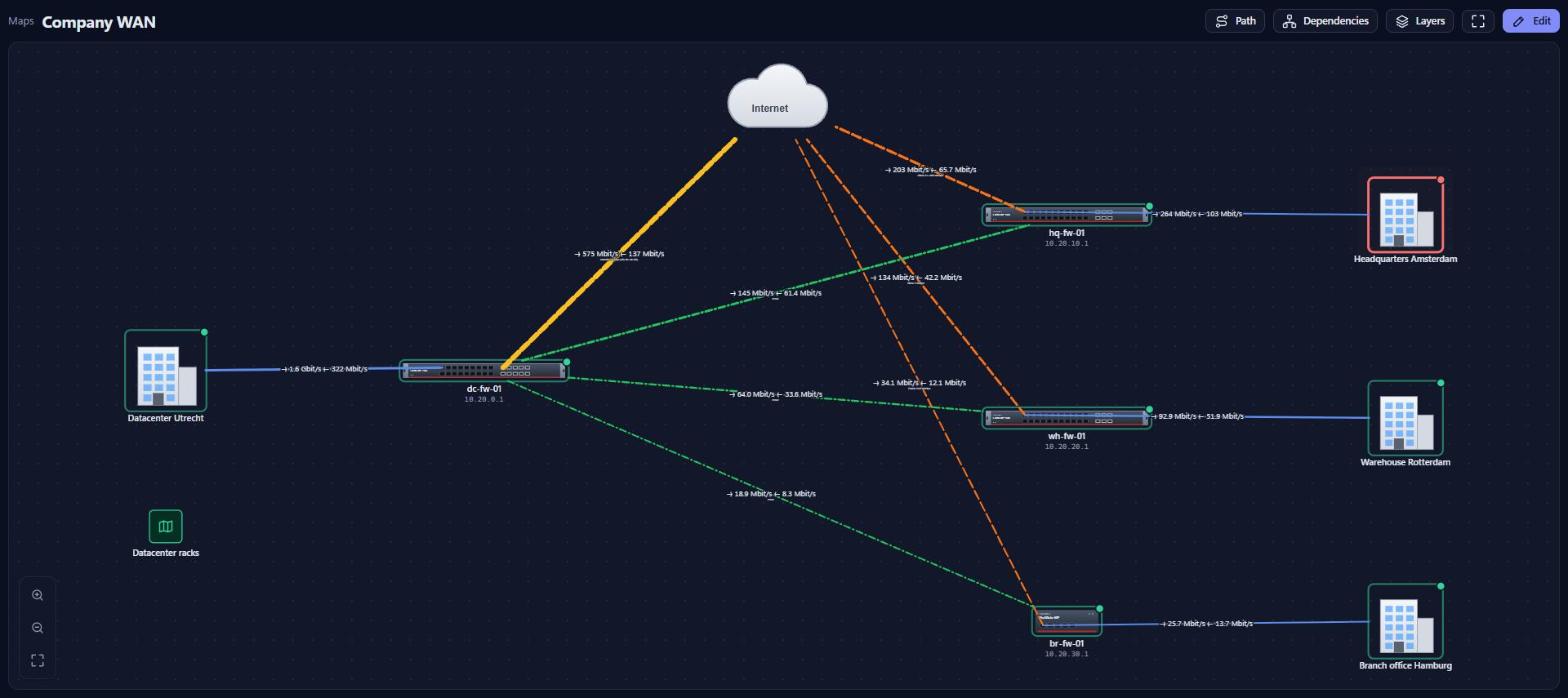
 Company WAN: sites, VPN tunnels and internet links with live traffic and status
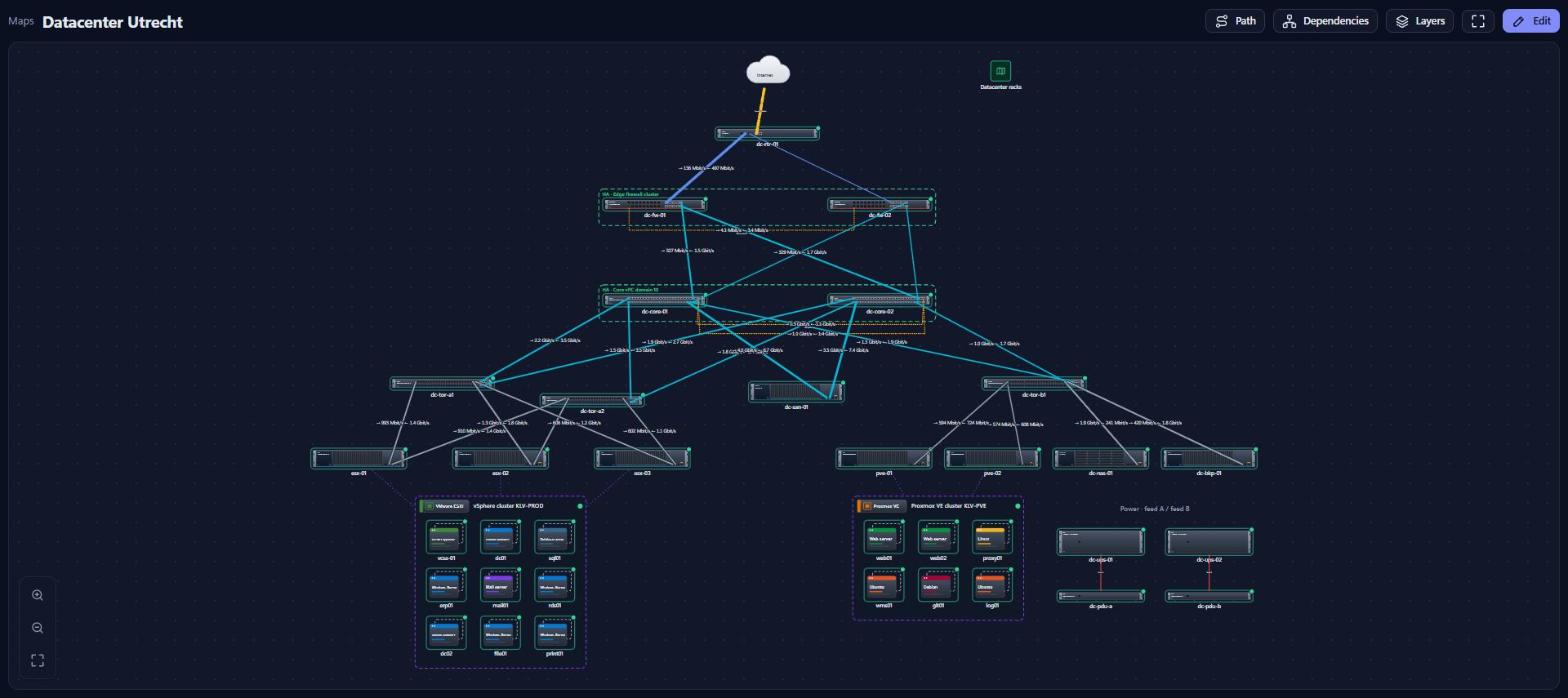
Datacenter map: firewall and core clusters, servers, VM clusters and storage, with traffic on every link
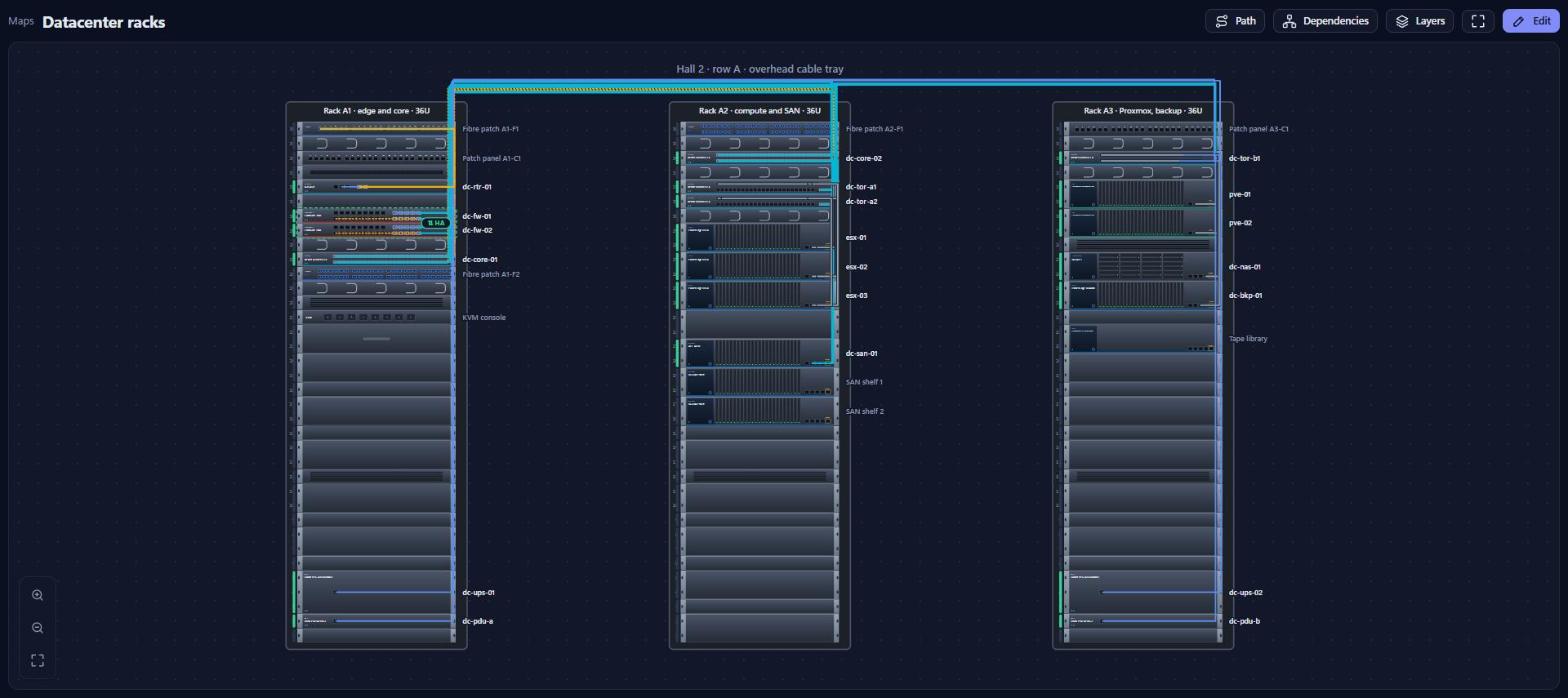
Racks with every device in place and the cables between them
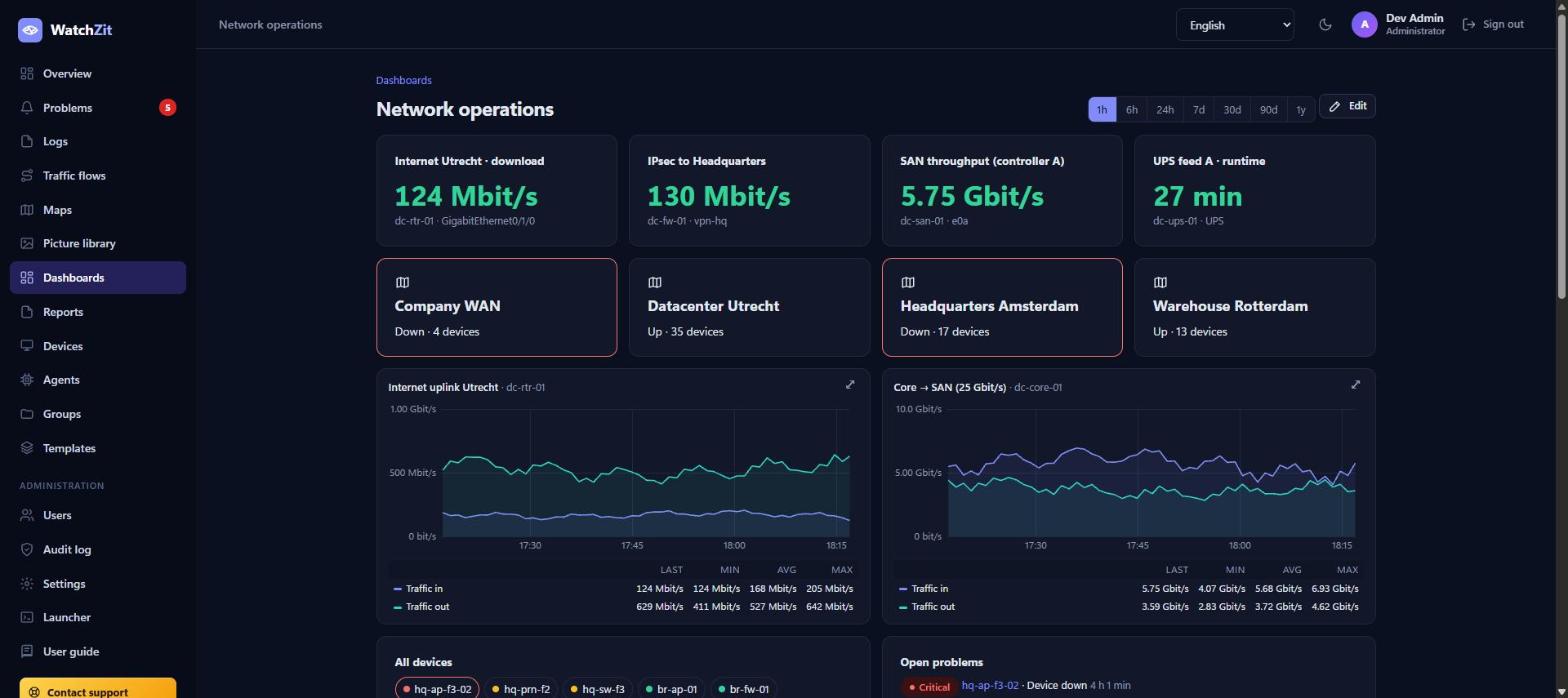
Dashboard: key values, map status, traffic graphs and open problems
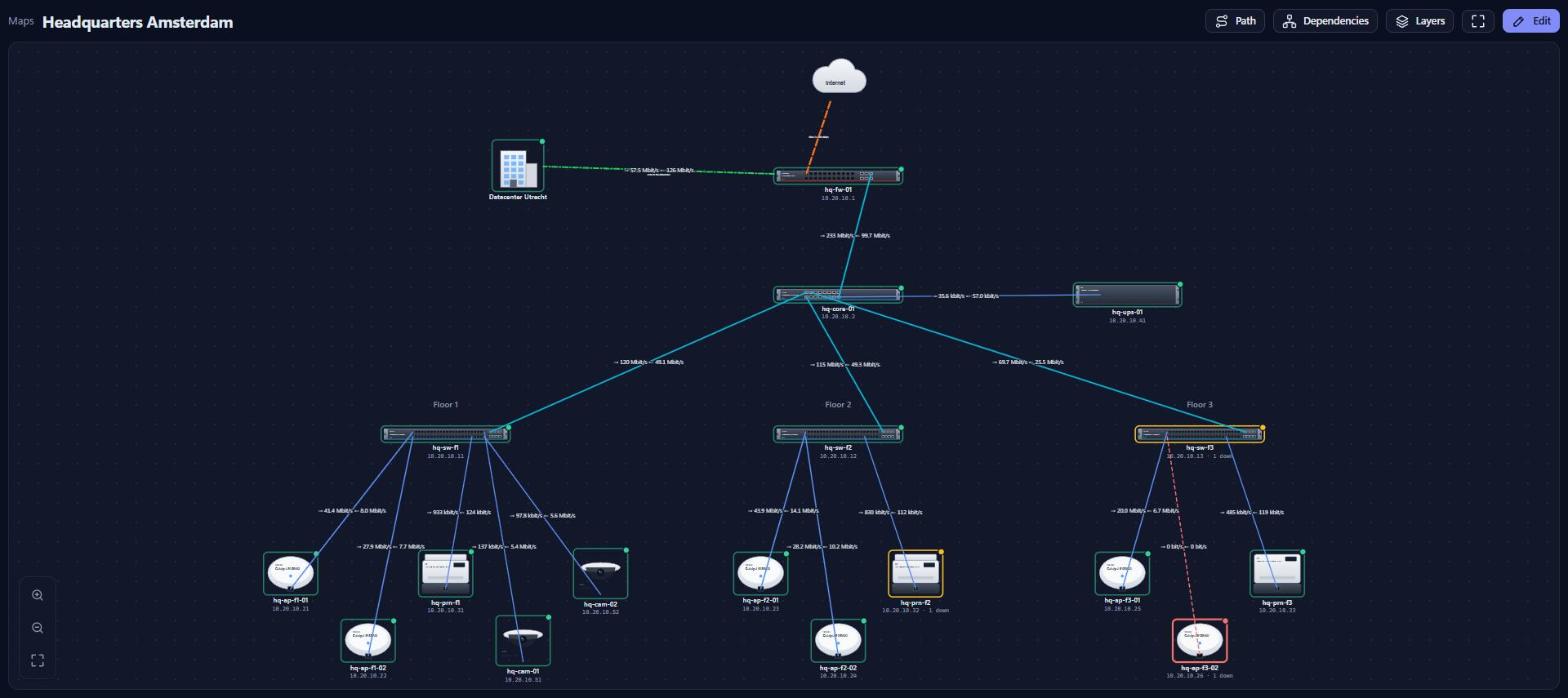
Headquarters map: switches, access points and printers floor by floor, with a device that is down
Why WatchZit
Your server, your network
No cloud service and no account with us. The ready-made appliance runs without internet access; agents and remote collectors connect outbound, so monitored computers and branch offices need no open ports.
One console instead of three
Map, measurements, alerts, graphs, logs and traffic flows share one device list and one database, so a problem on the map leads straight to its graphs, its logs and the device itself.
Secure by default
HTTPS only, two-factor sign-in for every local account, roles, allowed networks, brute-force blocking, encrypted secrets, a hash-chained audit log and signed updates.
Years of history
Measurements are kept raw for 30 days, as 5-minute values for 90 days and as hourly values for two years by default — compressed in PostgreSQL, so there is only one database to back up.
In your language
The console and its built-in user guide speak 14 languages: English, German, French, Spanish, Italian, Portuguese, Dutch, Polish, Czech, Serbian, Turkish, Russian, Chinese and Japanese.
Free, with support if you want it
Open source under the AGPLv3, with no license keys and no paid edition. Commercial support comes from MaxZit, the company behind WatchZit.
Guides
A modern alternative to MikroTik The Dude
Live network maps like The Dude in a browser: install WatchZit for free, discover devices, read MikroTik over SNMP and the API, draw maps and get alerts.
Monitor branch offices with a remote collector
Monitor branch offices and networks behind NAT with a WatchZit remote collector: enroll it, assign devices, discover the site, maps, alerts and failover.
Agentless Linux and Windows server monitoring over SSH and WinRM
Monitor Linux over SSH and Windows over WinRM without installing an agent: CPU, memory, swap, disk and uptime in WatchZit, with alerts and forecasts.
An open-source Zabbix alternative: from install to useful monitoring
WatchZit as a free, self-hosted Zabbix alternative: discovery, SNMP, built-in and learned triggers, agentless checks and self-drawing maps.
A free PRTG alternative for Windows networks and network devices
WatchZit as a free, self-hosted PRTG alternative: Windows agent via GPO, AD sign-in, SNMP switches, printers and UPSs, Teams alerts, branch collectors.
A LibreNMS and Observium alternative for SNMP network monitoring
WatchZit as a free, self-hosted LibreNMS or Observium alternative: SNMP discovery, switches, printers, UPSs, MikroTik, port graphs, live maps.
A Nagios and Checkmk alternative: server and service checks without config files
WatchZit as a free, self-hosted Nagios or Checkmk alternative: server and web checks set up in the browser, agent or SSH/WinRM, escalation and on-call.
How it works
- The server is a small Linux VM (2 vCPU, 2 GB RAM, 16 GB disk) — a ready-made appliance or packages for Debian, Ubuntu, AlmaLinux and Rocky Linux.
- The console (8443) answers only the networks you allow; the agent endpoint (8444) can be opened to the internet for computers and collectors at other sites.
- An agent enrolls with a one-time code that holds the server's address and the fingerprint of its agent certificate, so it talks only to your server.
Running in minutes
Import the ready-made appliance — OVA for VMware, qcow2 for Proxmox/KVM, VHDX for Hyper-V — boot the appliance ISO, or install on an existing Debian, Ubuntu, AlmaLinux or Rocky Linux server:
curl -fsSL https://github.com/Max-Zit/watchzit/releases/latest/download/install.sh | sudo shThen open https://<server>:8443, enter the setup token and create the first administrator. Add devices or let WatchZit discover a network, and draw your first map. All downloads and install options.
Frequently asked questions
Is WatchZit free?
Yes. WatchZit is free and open source under the GNU AGPLv3. There is one edition with every feature and no license keys. MaxZit offers optional commercial support.
What can WatchZit monitor?
Routers, switches, firewalls, servers, PCs, printers, UPSs, web sites and services: over ping, TCP, HTTP(S), DNS, SNMP v1/v2c/v3, the MikroTik RouterOS API, PostgreSQL, MySQL/MariaDB and JSON APIs such as FortiGate's, and with the agent on Windows and Linux computers. VMware ESXi and vCenter, Proxmox VE, Hyper-V and Docker show their virtual machines and containers.
Do I need to install an agent?
No. The agent is optional: devices without it are monitored over ping, ports and SNMP. It adds what the network cannot see — CPU, memory, disks, services and processes of a computer, and errors from the Windows event logs and the systemd journal.
Does WatchZit need the cloud or internet access?
No. The server runs in your own network, and the ready-made VM image needs no internet access at all. New versions come from GitHub, or you upload them as files on servers without internet access.
How is WatchZit different from The Dude, Zabbix or Grafana?
WatchZit brings their main ideas together in one product: a live network map with discovery, checks with triggers, dependencies and notifications, and dashboards with outside data sources. It is installed in minutes as one appliance or package, with PostgreSQL as its only database.
Can WatchZit monitor branch offices and networks behind NAT?
Yes. Install the agent there as a remote collector: it runs the checks of its site, discovers its network and keeps measuring while the connection to the console is down. A second collector can take over. The site needs no open port.
How does WatchZit tell me about problems?
By email, Slack, Microsoft Teams, Discord, Telegram, ntfy, PagerDuty, SMS or signed webhooks, with escalation, repeats and on-call hours per channel. Dependencies keep a dead router from flooding you with the alarms of every device behind it.
Can I open a device from the map?
Yes: its web interface, or SSH/PuTTY, RDP, WinBox, VNC, Telnet and your own programs on your Windows PC through the small MaxZit Launcher, which accepts only signed links from consoles you paired.